PSD Data
The Random Vibration Analysis and PSD Data are accessible for the NONE code. For other codes, these options are disabled from the menus.
PSD Data is a table of maximum response versus natural frequency for a specific excitation in single degree-of-freedom systems. You can input PSD Data in three ways:
1. Input PSD Data directly into the model.
2. Create a PSD Data library and load PSD Data from it.
3. Input PSD Data from a text file.
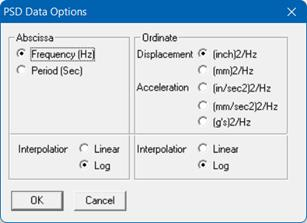
When you use the first two methods, you may use menu Options > PSD Data command to set the different units for the Ordinate and the Abscissa, and also choose the interpolation method.
1. Input PSD Data directly into the model
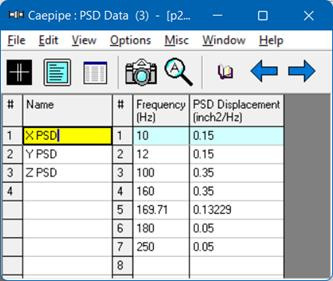
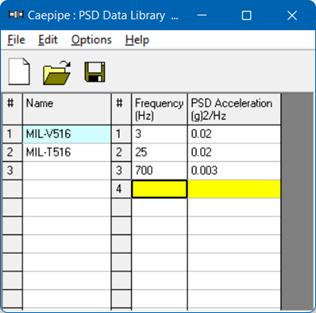
Select PSD Data from the Misc menu. You are shown the List window for PSD Data profiles. Start typing pairs of values into it. The frequencies or periods do not have to be in any order; CAEPIPE will sort them later. You can input as many pairs of values as required.
2. Create a PSD Data library and load profiles from it
From the Main, Layout or Results window, select menu File > New.
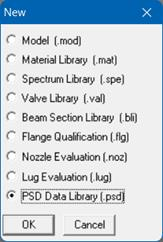
Select PSD Data library. The PSD Data library List window is shown.
The frequencies or periods you type can be in any order. CAEPIPE will sort them later. You can input as many pairs of values as required. Be sure to save the file (it will be saved to a filename you specify, with a .psd extension) using the Save command in the File menu.
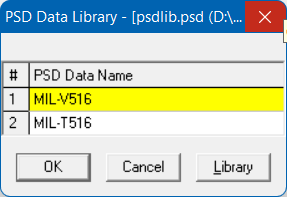
Now, open the CAEPIPE model that needs these PSD Data profiles. Open the saved library (menu File > Library) and input PSD Data Name into the model from the shown list.
3. Input PSD Data profiles from a text file
This method involves creating a separate text file (in the format shown below) for each profile you want to input. The steps are given below.
a) For each PSD profile, on the first line, type the Name of the PSD Data profile (up to 31 characters). On the second line, type units for Abscissa (X-axis) and Ordinate (Y-axis) axes, separated by a space.
b) After these two lines, on each line, you can input a value pair. You can input as many of these value pair lines as required.
c) Each PSD Data profile should be saved to a separate text file. More than one profile should not be input in one text file as it cannot be read into CAEPIPE.
d) Now, open the CAEPIPE model that needs these profiles. Select Read PSD Data from the File menu, read all text files you created one after the other.
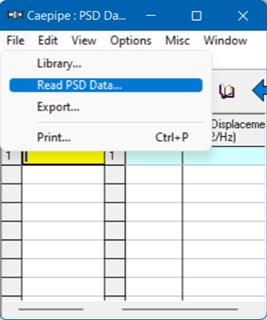
The format of a PSD Data text file is shown below. The profile that is read appears on the row where the yellow highlight is placed (under the Name column). You can use the Edit menu commands to insert an empty row or delete an existing profile. Ensure that no two profiles share the same Name. CAEPIPE issues a warning should such occur.
The PSD Data text file should be in the following format:
|
Name (up to 31 characters)
| ||
|
Abscissa units
|
Ordinate units
|
|
|
Abscissa value1
|
Ordinate value1
|
|
|
Abscissa value2
|
Ordinate value2
|
|
|
.
|
.
|
|
|
.
|
.
|
|
|
.
|
.
|
|
|
Where
|
| |
|
Abscissa units
|
0 = Frequency (Hz)
| |
|
|
1 = Period (Sec)
| |
|
Ordinate units
|
0 = Displacement (inch)^2/Hz
| |
|
|
1 = Displacement (mm)^2/Hz
| |
|
|
2 = Acceleration (in/sec^2)^2/Hz
| |
|
|
3 = Acceleration (mm/sec^2)^2/Hz
| |
|
|
4 = Acceleration (g’s)^2/Hz
| |
Example file
Test PSD-Value
0 2
1 190
2 220
3 250
4 1932
5 1000
6 1800
. .
. .
Analysis notes: Response to PSD excitation
In Random Vibration Analysis, the variance/response of the system is evaluated in the frequency range specified in the PSD Data table. The lowest and highest frequency specified in the table are the lower and upper bounds of integration. The natural modes falling outside the frequency range of PSD Data table will not be considered in the analysis. It is users’ responsibility to specify PSD Data across the desired range of frequency.
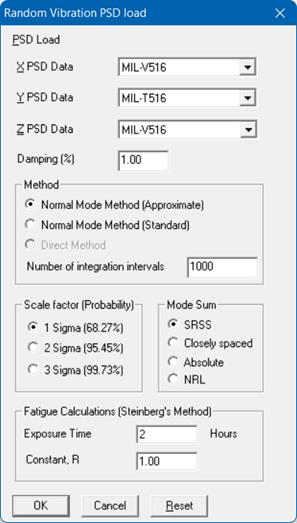
Once you are done inputting the different PSD Data using any one of the three methods, you need to input the PSD Data load itself under the menu Loads > Random Vibration in the Layout window. Details on inputting the PSD Data load are provided earlier under the Loads menu.