Fatigue Curves
Fatigue refers to the progressive and localized structural damage that occurs when a material is subjected to cyclic loading. It often leads to the initiation and propagation of cracks, and eventual failure. The study of fatigue is essential for ensuring the reliability and longevity of piping components in various applications, such as process, power, nuclear, aerospace, etc.
Starting CAEPIPE Version 13.00, Detailed Fatigue Evaluation can be performed. ASME Section VIII Division 2 provides guidelines for applying fatigue evaluation rules to piping and other pressure-retaining equipment. Where applicable, these guidelines have been followed in the methodology implemented in CAEPIPE.
CAEPIPE Fatigue evaluation is based on Miner’s Rule (Damage Accumulation Theory). This rule is generally used to estimate the fatigue life under variable loading conditions by summing the damage fractions from all load cycles. To perform Detailed Fatigue Evaluation, S-N Curve data for each Material is to be input into CAEPIPE through this option “Fatigue Curves”.
Fatigue Curves S-N Curve (Wöhler Curve) is a plot of alternating stress amplitude (S) versus the number of cycles to failure (N). It provides a graphical representation of the material's fatigue strength.
The current version of CAEPIPE is supplied with seven (7) Fatigue Curves corresponding to the Figures 3-F.1 through 3-F.7 of ASME Section VIII, Division 2 (2021). These Fatigue Curves are available inside the folder “Fatigue_Curves” of CAEPIPE installation directory.
You can also construct additional fatigue curve text files and use them in CAEPIPE. For more information on adding fatigue curve text files, see the section given below.
For better clarity, Fatigue Curves can be input into CAEPIPE in three ways as detailed below.
Note:
Detailed Fatigue Evaluation is not available for the Piping Analysis codes ASME NM.1, ASME NM.2, EN 13941, ISO 14692, DNV-ST-F101, BS 806 (1986) and NONE code. In addition, Detailed Fatigue Evaluation cannot be performed on Plastic and FRP/GRP piping materials.
1. Import Fatigue Curves (S-N Curve) supplied with CAEPIPE into the stress model
Fatigue Curves supplied with the product are available inside the folder “Fatigue_Curves” of CAEPIPE installation directory. These Fatigue Curves can be imported into CAEPIPE as given below.
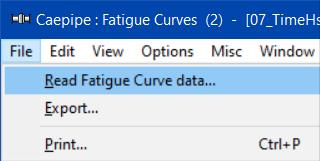
1. Select the option “Read Fatigue Curve data” through Layout Window > Misc > Fatigue Curves > File Menu.
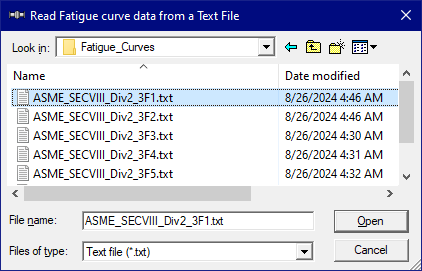
2. Navigate to the folder “Fatigue_Curves” in the installation directory.
3. Select the required Fatigue Curve data file and then press the button “Open” as shown below.
2. Create a text file for Fatigue Curves (S-N Curves) and read it into CAEPIPE
Read text file containing the S-N Curve data into CAEPIPE using the menu File > Read Fatigue Curve data. Any number of lines as Comments or Notes related to the S-N Curve data can be entered into the text file by inputting the starting characters as “//” at the beginning of the text file for future reference. CAEPIPE ignores all the Comments that start with these “//” characters. Following the comment lines, enter the unit as either “SI” or “ENGLISH”. When you enter “SI”, then CAEPIPE will know that the Alternating Stress values are input in “MPa”. On the other hand, when you enter the unit as “ENGLISH”, then CAEPIPE will know that the Stress values are input in “psi”.
For each S-N Curve data, you then need to type a Name (up to 5 characters) followed by a Description (up to 31 characters) on the next line, type Stress followed by a Cycle (separated by a space) on the following lines.
You can input as many Alternating Stress-Cycle pairs (one pair on each line) as required. If you have more than one S-N Curve data, then they can be defined in the same text file by adding the tag “-1.e11” at the end of each S-N Curve data.
The format of the S-N Curve data text file is shown below. You can use the Edit menu commands to insert an empty row or delete an existing row. Ensure that no two S-N Curve data share the same Name. CAEPIPE issues a warning should such occur.
Note:
CAEPIPE will sort the S-N Curve data values in the ascending order of Alternating Stress (after entering them or after importing the file) into the Fatigue Curves table.
Sample S-N Curve Data
//Fatigue Curve from Figure 3-F.1 of ASME Section VIII, Div 2.
//for Carbon, Low Alloy, Series 4XX, High Alloy, and High Tensile Strength
//Steels for Temperatures Not Exceeding 700°F — σuts ≤ 80 ksi
ENGLISH
3F1
CS-LA-4xx-HA-HTS-80
600E+3 1E+1
200E+3 1E+2
80E+3 1E+3
40E+3 1E+4
20E+3 1E+5
15E+3 1E+6
11E+3 1E+7
10E+3 1E+8
9E+3 1E+9
8E+3 1E+10
7E+3 1E+11
-1.e11
3F2
CS-LA-4xx-HA-HTS-80
7E+3 1E+11
8E+3 1E+10
9E+3 1E+9
10E+3 1E+8
11E+3 1E+7
15E+3 1E+6
20E+3 1E+5
40E+3 1E+4
80E+3 1E+3
200E+3 1E+2
600E+3 1E+1
3. Input Fatigue Curves (S-N Curve) manually into the model
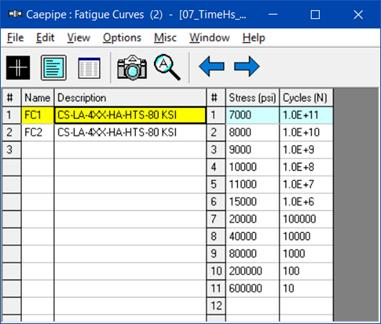
Click on menu Misc > Fatigue Curves to input fatigue curve data. Fatigue Curve data is in the format “Stress vs Cycles (Number of Cycles to failure)”. Stress (Alternating Stress) values can be input in English/SI/Metric units by selecting the required Stress unit through Options > Units. While performing the Detailed Fatigue Evaluation, CAEPIPE will internally interpolate Fatigue Curve data (S-N Curve data) in log scale. For now, simply start typing the Alternating Stress-Cycles pairs as shown below.
Next, select the required Expansion load cases for analysis through Loads > Load cases, enter the actual Number of Thermal Cycles corresponding to each of the Expansion load cases selected for analysis through Misc > Fatigue Cycles, assign the S-N Curve data to the respective Materials through Misc > Materials and then turn ON the option Detailed Fatigue Evaluation through Loads > Detailed Fatigue.