Sorted Stresses
Here, CAEPIPE displays the stresses at nodes sorted in the descending order of stress ratios for Sustained, Expansion, Occasional, Settlement, etc. depending upon the Piping Code selected for Analysis.
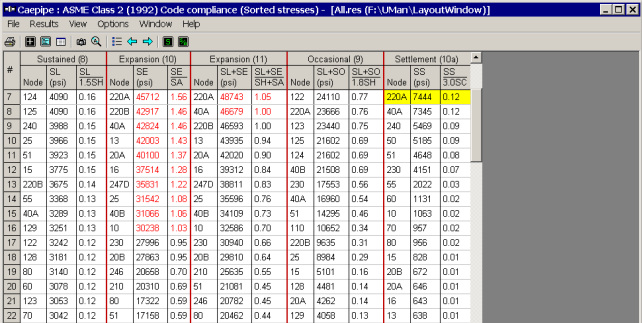
For sorted stresses, you are shown Show stresses, Show stress ratios, Thresholds and Hide Allowables (see image on previous page). The resulting actions of the first three commands apply to the Graphics window and the last one applies to the Results window. For example, in the previous image CAEPIPE will remove five columns (1.5SH, SA, SH+SA, 1.8SH and 3.0SC) when you select “Hide Allowables” thereby allowing you to reduce the information presented. See next figure (in which “Allowables” are hidden).
Under Expansion Sorted Stresses, CAEPIPE will compute and display the maximum stress ratio at a particular node among all Expansion load cases selected for analysis. For example, if Expansion (T1), Expansion (T2), Expansion (T3), Expansion (T1 – T2) and Expansion (T1 – T3) load cases are selected for analysis, then CAEPIPE will compute the maximum stress ratio from the 5 load cases selected at each node and display the same under Expansion Sorted Stresses.
Similarly, under Occasional Sorted Stresses, CAEPIPE will compute and display the maximum stress ratio at a particular node among all the Occasional load cases (such as Seismic 1, Seismic 2, Seismic 3, Wind, Wind 2, Wind 3, Wind 4, etc.,) selected for analysis.
For better clarity, see the example provided below from ASME Class 2 (2021) Stresses of a Sample model.
|
Sl. No.
|
Load Case
|
Node
|
SL+SO
(psi)
|
SHO
(psi)
|
Stress Ratio (=SL+SO/SHO)
|
|
1
|
Seismic 1
|
3
|
9862
|
30492
|
0.323
|
|
Seismic 2
|
5242
|
38115
|
0.138
| ||
|
Seismic 3
|
5407
|
50820
|
0.106
| ||
|
Wind 1
|
9762
|
30492
|
0.320
| ||
|
| |||||
|
2
|
Seismic 1
|
9001A
|
514
|
30492
|
0.016
|
|
Seismic 2
|
1060
|
38115
|
0.028
| ||
|
Seismic 3
|
1684
|
50820
|
0.033
| ||
|
Wind 1
|
1178
|
30492
|
0.039
| ||
From the table shown above for two (2) nodes, the maximum stress ratio at Node 3 and 9001A are from Seismic 1 and Wind 1 respectively. Hence, under Occasional Sorted Stresses, CAEPIPE will show the values (shown in Gray highlight above) corresponding to the maximum stress ratio for these two nodes.
If you wish to review the Stresses for each load case selected for analysis, then view them through “Element forces” results of CAEPIPE.
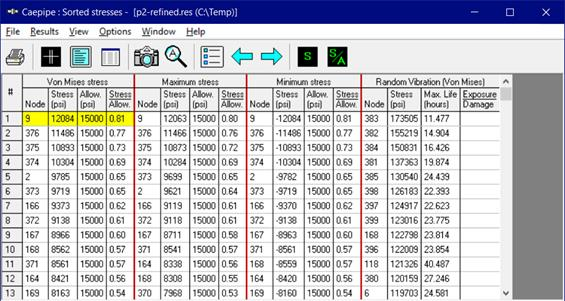
When Random Vibration load cases are included in the Analysis for NONE code, then CAEPIPE will show additional columns under the title Random Vibration (von Mises) under Sorted Stresses results as given below.
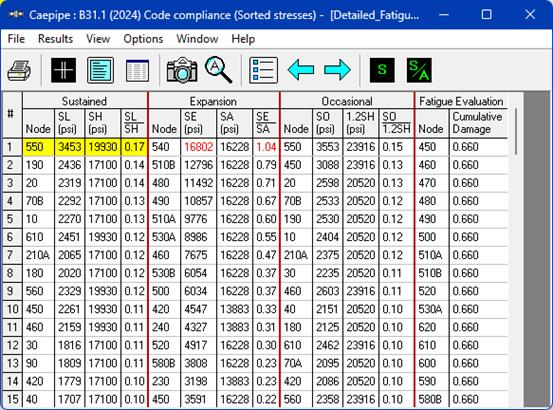
When the Detailed Fatigue Evaluation is enabled in the analysis for applicable piping codes, CAEPIPE will display additional columns under the "Fatigue Evaluation" section. These columns will show the cumulative damage calculated at each node for the selected expansion load cases, as illustrated below.
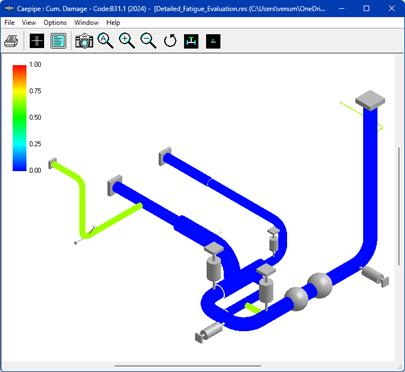
A few screenshots of Results window with the different results items are shown next.