Tutorial on Random Vibration Analysis using CAEPIPE
General
Random vibration analysis for piping/tubing/ducting systems is a critical aspect of engineering design aimed at understanding and mitigating the effects of random dynamic loads on such systems. In essence, it involves evaluating how the systems respond to stationary stochastic excitations from surroundings, such as seismic events, flow induced vibrations or machinery vibrations, which are often unpredictable in nature.
A Random Vibration Analysis in CAEPIPE can be used when a piping/tubing/ducting system is subjected to a non-deterministic, continuous uniform base excitation at supports. The solution is formulated in the frequency domain when the uniform support excitations are expressed by power spectral density (PSD) functions. Given below is a sample problem for Random Vibration analysis of a tubing system.
Sample Problem
Problem Definition
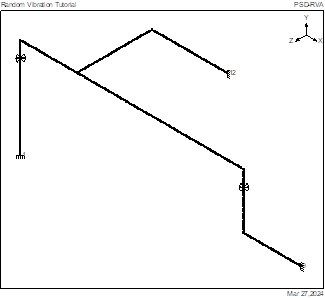
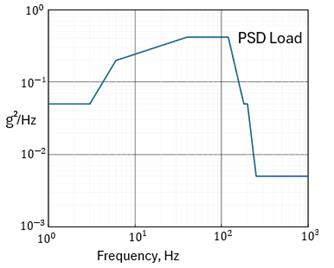
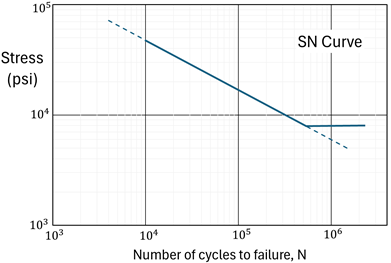
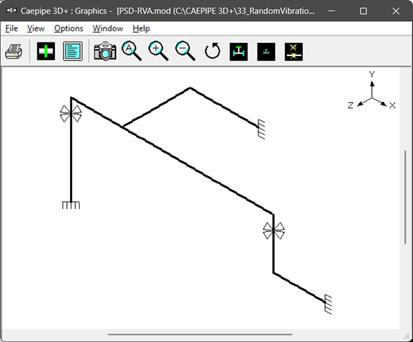
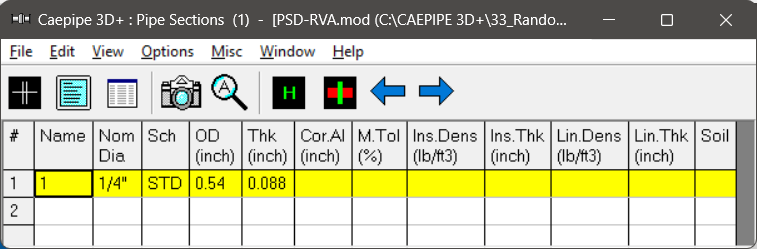
In this tutorial, a Random Vibration Analysis of a tubing layout as shown in the figure above measuring ¼ inch in size with STD Schedule and a material density of 0.403 lb/in³ is performed. This tubing layout is subjected to a PSD load as shown in the graph below for a duration of 60 hours with uniform base excitation at its supports. In order to calculate the damage factor, the required SN curve for Fatigue evaluation is provided below.
Step 1
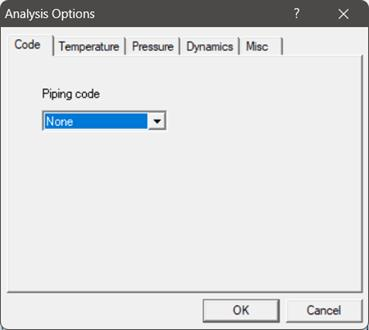
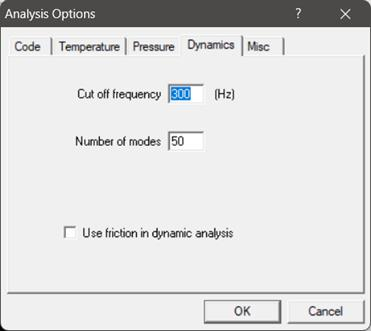
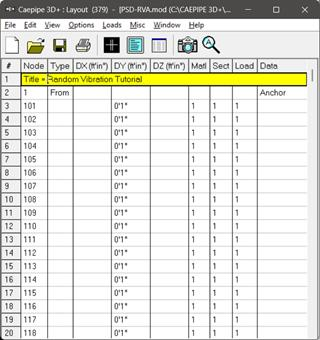
At this time, the Random Vibration analysis is available only for NONE code in CAEPIPE. The Analysis Options chosen for this layout are shown below along with its Layout Window and Graphics Window.
Step 2
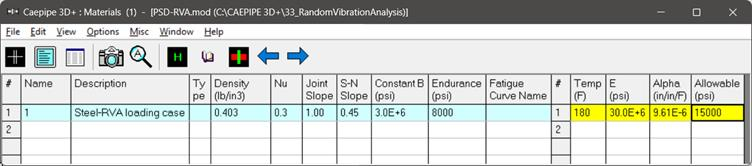
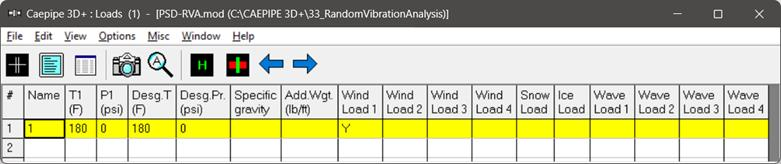
The details on material properties, pipe sections and loads are given below.
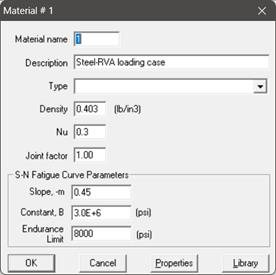
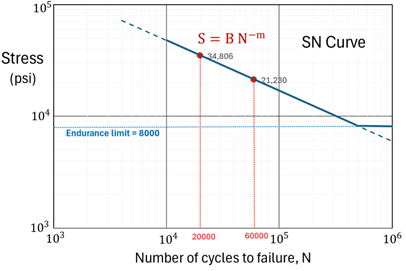
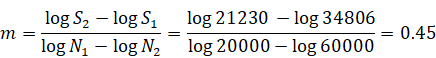
Input the slope m (must be a positive integer) of the S-N curve, -m. From two known data points (N1, S1) → (20000,34806) and (N2, S2) →(60000,21230), the slope of the S-N curve m can be calculated as:
The constant "B" is the fatigue strength coefficient and can be calculated from any known data point and slope m, as
Input the endurance limit of the material. The endurance limit is the stress limit below which there is no fatigue failure. Refer to the Section titled “Dynamic Analysis” in the CAEPIPE Technical Reference Manual for further details.
Step 3
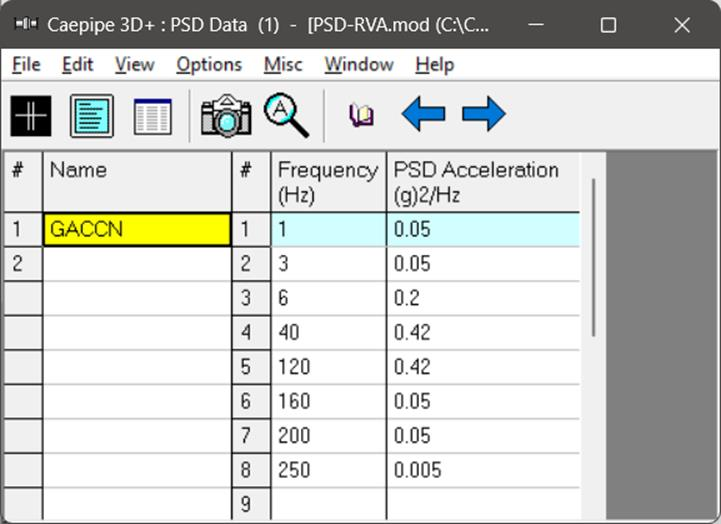
Input the PSD Data through Layout window > Misc > PSD Data.
Note:
The variance/response of the system is evaluated in the frequency range specified in the above PSD Data table. The lowest and highest frequencies specified in the table are the lower and upper bounds of integration. The natural modes falling outside the frequency range of PSD Data table will not be considered in the analysis. It is users’ responsibility to specify PSD Data across the desired range of frequency.
Step 4
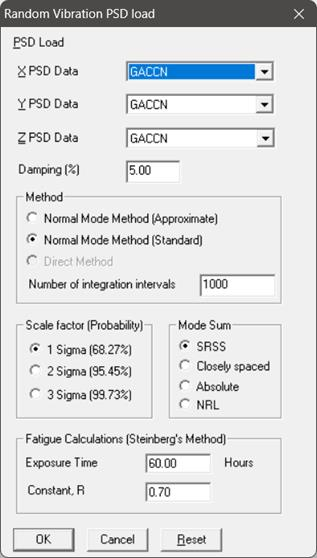
Define the Random Vibration load through Layout window > Loads > Random Vibration. Select the PSD Load Data for Global X, Y and Z directions from the list. Enter the Damping (in %) as shown in the below snapshot. Choose the Method as “Normal Mode Method (Standard)”, Scale factor (Probability) as “1 Sigma (68.27%)”; and Mode sum as “SRSS”. For further details on the input parameters and the analysis type, refer to the Section titled “Random Vibration” in CAEPIPE User’s Manual.
Step 5
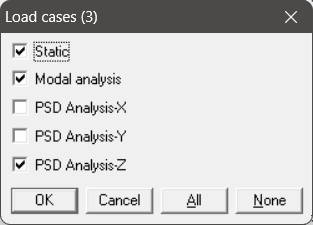
After defining the directional PSD loads, the Load cases corresponding to the Random Vibration analysis will appear in Load Cases dialog seen through Layout Window > Loads > Load Cases. Select the preferred load cases, save the model and perform the analysis through Layout window > File > Analyze.
RESULTS
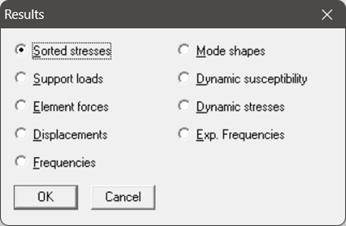
After finishing the analysis and choosing to see the results or by opening the results file (.res), the results window is displayed. The “Results” dialog is opened automatically as shown below.
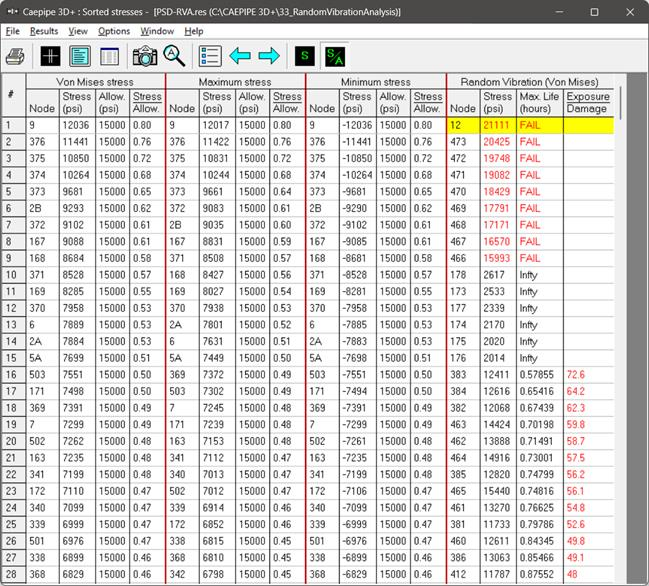
Sorted Stresses
The computed stresses (“Von Mises”, “Maximum stress”, “Minimum stress” are sorted in descending order by stress ratios for Static load case. On the other hand, Von Mises stresses corresponding to Random Vibration analysis are sorted in descending order of the damage factor when the exposure time is input, or else the sorting will be based on stress intensity alone.
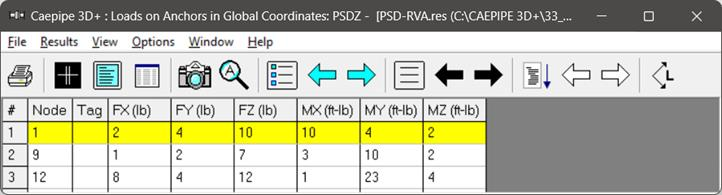
Support loads
Support loads are the loads acting on the supports by the tubing system for the selected load case. The loads on anchors for the “PSDZ Load” case are shown below.
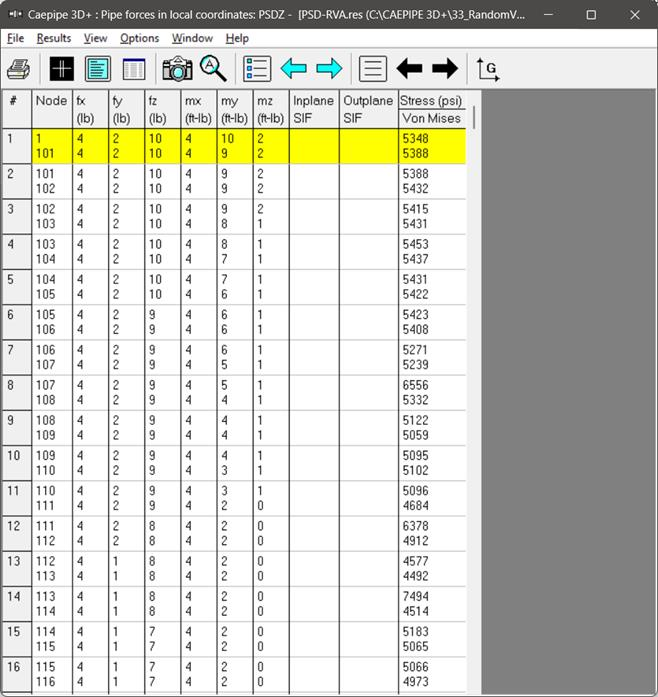
Element Forces
For pipe (also bend and reducer), element forces in local coordinates, “Stress Intensification Factors” (SIF) and Von Mises stresses are shown by default for the selected load case.
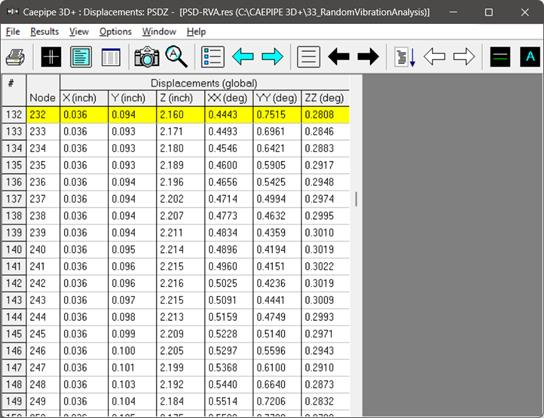
Displacements
The nodal displacements for “PSDZ load” case are shown below.
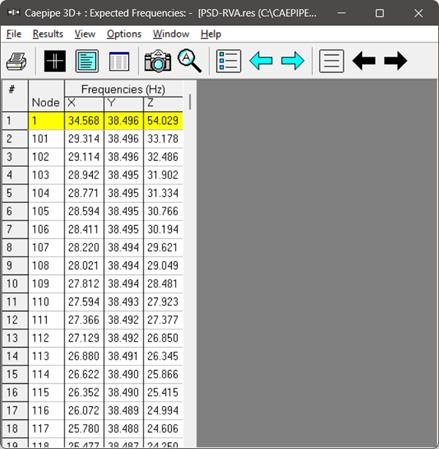
Expected Frequencies
The Expected Frequencies for vibration displacement in Global X, Y and Z directions corresponding to “PSDZ Load” case for each Node is shown below.