Software Solutions
- CAEPIPE 3D+
- dataTRANSLATORS
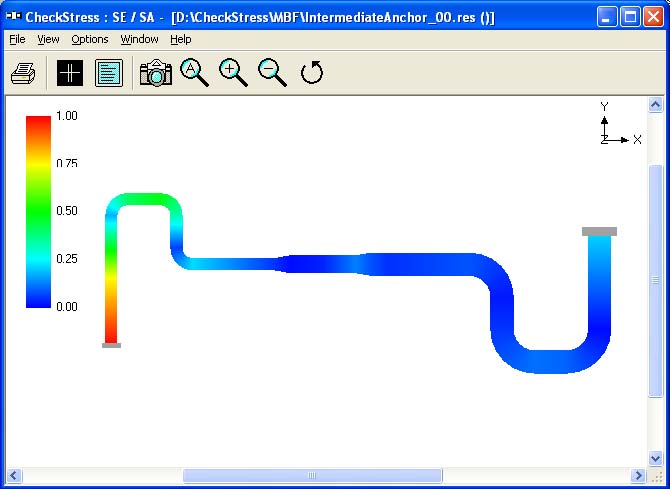
- checkSTRESS
- HOTclash
- PEXit
- Pricing Request
- Download CAEPIPE 3D+
- Download Free Evaluation
- Download Free Review Module
- Customer Support
Engineering Services
- Design and Engineering
- INFOplant™ System
- Engineering Management
- List of Projects
- Project Gallery
- Project Videos